-
View article
 #Financial publications
Interview with Anne-Catherine Ropers - Significant full-year earnings and a transitional fourth quarter marked by the launch of the new MTP
2026/04/30 -
View article
 #Financial publications
Interview with Clotilde L’Angevin - Robust results, a controlled management framework and the strength of our capital position support our progress
2026/04/30 -
View article
 #Group news
Crédit Agricole des Savoie becomes official partner of the 2027 UCI Haute-Savoie Mont-Blanc World Cycling Championships
2026/04/27
- #IBD Paris
- 2019/02/15
- 0
-
0
BPI : T4 2018 and full year 2018 results
BPI business line : Solid business activity momentum for all banks and all segments - Strong increase in revenues driven by growth in gross operating income and continued decline of the cost of risk.
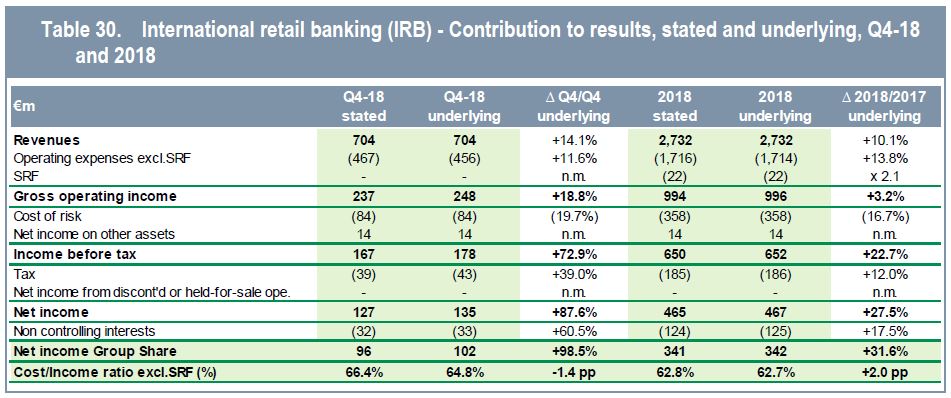
- Underlying net income of 102 M € in T4, +98.5% vs first T4 2017, mainly driven by growth in gross operating income (+18.8% vs T4 2018), thanks to a jaws effect positive now and an improvement in credit quality (cost of risks -19.7% vs T4 2017);
- Increase in net banking income +14.1% for T4 2018 vs T4 2017;
- Underlying cost/income ratio for the quarter excluding SRF at 64.8%, up 1.4 points vs T4 2017;
- Over a year, increase in net banking income +10.1% vs 2017, combined with the decrease of the cost of risk (-16.7% vs 2017);
- Underlying net income of 342 M€ over 2018, +31.6% vs 2017.
International Retail Banking represented 14% of the underlying revenues of Crédit Agricole SA’s business lines over the year 2018.
***
CA Italia
Solid business momentum against a disturbed backdrop in 2nd semester – Strong increase in revenues and improvement of asset quality following the merger of the 3 banks
For T4 2018 :
- Underlying net income at 52 M € for T4 2018, year-to-year increase of +76.6%
- Net banking income total 485 M €, up +17.5% for T4 2018 vs T4 2017, highest level of revenues generated during the year, reflecting the successful integration of the 3 banks.
- Underlying operating expenses at 320 M €, +16,6% (+45 millions €) vs T4 2017.
- Underlying cost/income ratio at 66.1%, up by 0.5 point vs T4 2017.
- Cost of risk at 64 M € at T4 2018, -14% vs T4 2017, amounted to 67bp.
For 2018 :
- Underlying NIGS at 196 M€, +22% vs 2017.
- Underlying cost/income ratio at 62.2%, down by -3.1 points primarily due to consolidation of the 3 banks.
- Underlying RoNE of CA Italia at 9.5% in 2018, compared to 9% in 2017.
- Increase of approx. 140 000 new customer relationships over 2018 generating a net increase of 20 000 active clients.
- Development of outstanding collections and credit: • Total customer savings at 74,3 billion € at end-December 2018, -2.3% vs end 2017 • Off-balance sheet customer savingsat 33.7 billion € at end-December 2018, stable vs end-December 2017. On-balance sheet deposits at 40,6 billion € at end 2018 (-4.2% vs end 2017). • Loans at 42,2 billion € at end December 2018, stable (-0.1%) vs end-September 2017.
Activities of Crédit Agricole Group in Italy :
- Underlying NIGS at 573 M € over the year 2018, an increase of +5.7% vs 2017. Contribution of 13% to underlying NIGS of Crédit Agricole SA (excluding Corporate Centre) Continuous progression of intra-group synergies to 820 M€, +21% in 2018 vs 2016
- Loans at 67 billion € at end-December 2018, up by +3% over a year, including the scope effect (integration of Pioneer, the three banks acquired and Banca Leonardo), while deposits and customer funds amounted to 250 billion euros on the same basis.
Other BPIs
Dynamic sales activity and strong increase in net profit thanks to a lower cost of risk
For T4 2018 :
- Underlying NIGS of Other BPIs at 49 M € at T4 2018, x2.2 at constant exchange rate vs T4 2017
- Revenues at 220 M€, +7.2% vs T4 2017 (+6.6% excluding the currency effect) : highest level during 2018
- Operating costs +1.4% vs T4 2017 (+1.4% excluding the currency effect)
- Cost/income ratio +61.9%, up by 3.6 points vs T4 2017
- Cost of risk fell by -34.3% vs T4 2017 to -19 M€
By country :
- Egypt : NIGS +5% T4/T4 linked to growth in revenues (+14% T4/T4) and low cost of risk
- Poland : NIGS -28% T4/T4 thanks to good operational trends and a negative base effect for the cost of risk
- Ukraine : NIGS +49% T4/T4 thanks to growth in revenues (+22% T4/T4) and a very low cost of risk
- Crédit du Maroc : NIGS x6 T4/T4 in line with gross operating income +18%, sharp fall in the cost of risk (-67% T4/T4) and sale of real estate assets of 14 M€
- Serbia : strong improvement of operational performances with gross operating income +50%
For 2018 :
- Underlying NIGS at 146 M€, up by +47% vs 2017. Cost/income ration stable at +61.9%.
- Total On- and Off-balance sheet assets up +9.9% between end-December 2018 and end-December 2017, reaching 13,3 billion €.
- On-balance sheet deposits at 11,6 billion € at end-December 2018, +10% over 12 months (Egypt +23%, Ukraine +17%, Serbia +16%).
- Loans at 10,7 billion € at end-December 2018, +6,5% over a year, +7.4% T4/T4 (Egypt +24%, Ukraine +22%, Serbia +11%)
- Excess liquidity at 1,5 billion € at end-December 2018.